
This text is focused on application of some different photodiodes with their different response funcing. The photodiode junction is treated in many text books and courses. Engineers and physicist learned about it in solid state physics, electrodynamics and quantum mechanics. This is all good and useful, if you are one of the few who is concerned with fabrication of photodiodes or research in new junctions for particular wavelength uses. If you need to measure a pulsed laser performance or detect some optical response, then those sources might not help you much; A. Yariv.: “Before embarking on a description of the p-n diode detector, we need to understand the operation of the semiconductor p-n junction.”
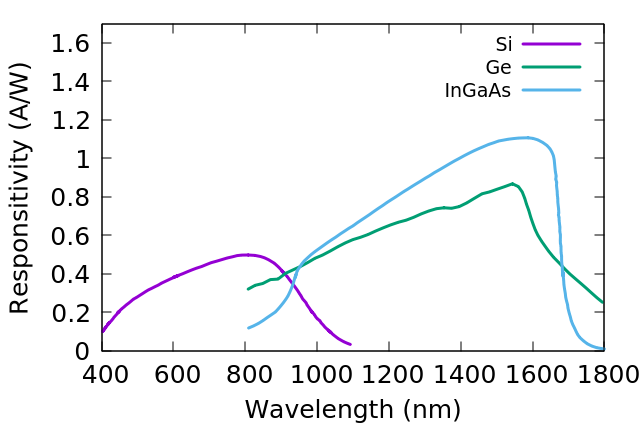
It is more productive to think of the photodiode device as a two terminal component which acts as a light controlled current source. For a reverse biased PD this holds pretty much true. The current is proportional to the optical power hitting the active area of the photodiode. The proportionality factor, the responsibility (R) depends on photon energy, so the wavelength of the light. The responsivity of the common photodiode material Si, Ge and InGaAs are shown in fig. 1.
A Si photodiode for example at the 632.8 nm Helium-Neon laser has a responsivity (R) of 0.4 A/W. To get a feel for that consider a P=100 uW signal impinged on the photodiode, we should expect a current (I).
I = P · R = 100E-6 W · 0.4 A/W = 4E-3A = 4 mA (1)
Using a biasedPD board with 50ohm termination this photo current gives a voltage swing of (U).
U = R · I = 50ohm · 4E-3A = 0.002V = 2mV (2)
This is just detectable on an oscilloscope, lower signal than that will require amplification. For amplification something like the AmplifiedPD circuit can be used.
It is interesting to note that the bias voltage has no effect on the amplitude of the photocurrent. We learn from this that voltage ripple on the bias supply is not translated into amplitude noise on the photo current. This goes against common belief that a very low noise bias supply is required. As long as the supply noise is not coupled to the signal after the PD the supply noise will only result in small perturbation of the detection bandwidth. The bandwidth does depend on the supply voltage, higher voltage gives higher bandwidth.
The responsivity versus wavelength shown in fig. 1 are for standard type Si, InGaAs and Ge photo diodes. There exist Si photo diodes UV Enhanced Si photo diodes and Extended InGaAs with responsivity shifted to longer wavelengths. Furthermore, the PD module may have a filter in front of the PD to modify the responsivity curve, flattening filter or band pass are common examples. The data in the graph is extracted from responsivity curved given in product data sheets. The data points can be downloaded as .csv file below.
Function approximation to PD responsivity curves
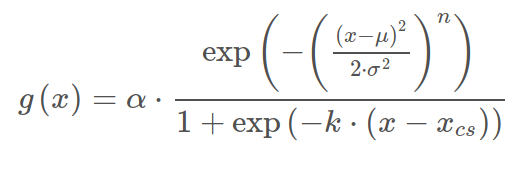
It can be practical to have a function expressing the photodiode responsibility as a function of wavelength. A function representation of the responsivity is useful for storing calibration or for calculation of products integrals. There is no function derived from basic principles for the responsivity as function of wavelength. Looking at the typical shape a tilted super Gaussian seem to represent the general shape. The Equation below is a super Gaussian multiplied with at sigmoid function. This function is used to fit the photodiode responsivity curves.
 (3)
(3)
With the Wavelength, Responsivity data in a file, e.g. extracted from datasheet graph with something like a Plot Digitizer, it is easy to fit the function using e.g. gnuplot.
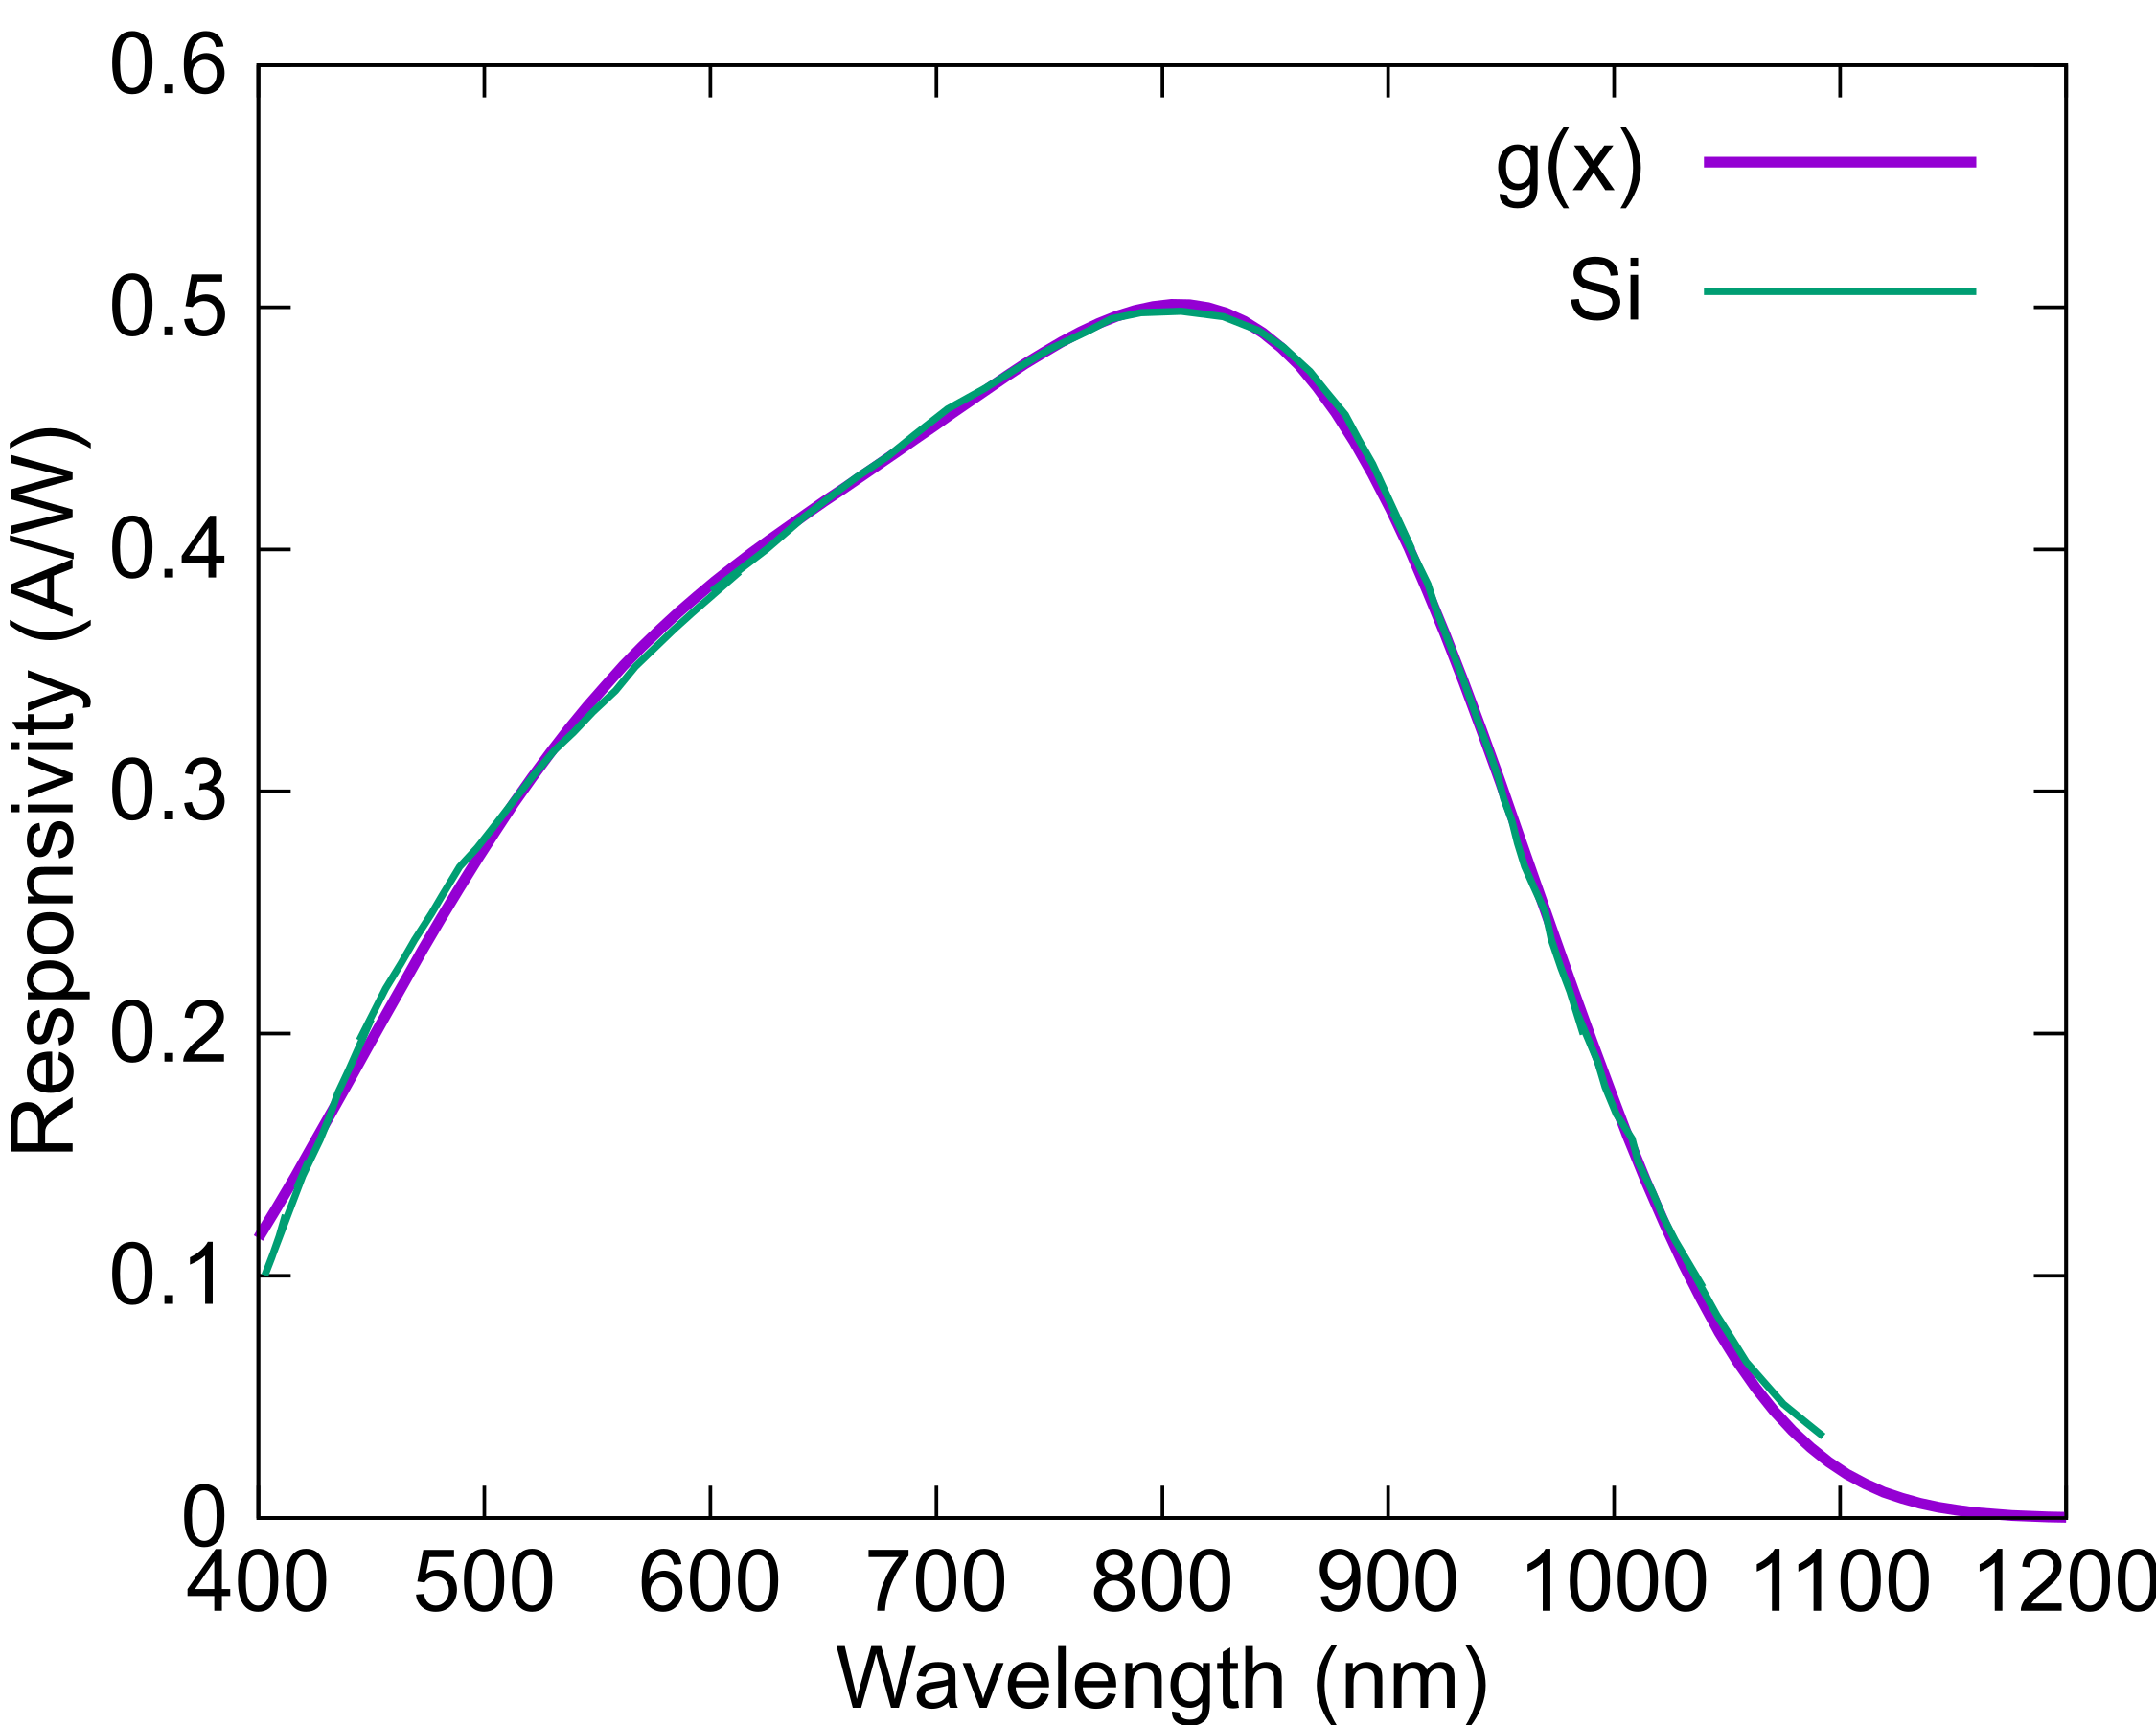
The fit reproduce the overall wavelength dependency well. The fitting function and parameters are as follows.
g(x)= alpha * exp(-((x - mu)**2 / (2 * sig**2))**n)/(1+exp(-k*(x-xcs)))
alpha = 2.71106
mu = 682.436
sig = 205.147
n = 1.78394
xcs = 1621.7
k = 0.00174692
It should be noted that there exist many Si photodiodes with responsivity deliberately modified to increase responsivity for short or long wavelengths. In general the responsivity shift to longer wavelengths for higher temperatures. Both edges may not shift the same and the long wavelength edge tends to shift more with temperature. I have experienced some frustrations trying to calibrate a Si PD at 1064nm using a CW laser source and a powermeter as reference for a low duty cycle pulse measurement. Even a low power CW laser caused heating of the PD bringing it to a higher temperature during the calibration, which therefor was not valid at the low duty cycle train pulsed measurement. Si photodiodes are well suited for the visible range of wavelengths 380nm to 750nm and a couple of important near IR wavelength. For pulse shape characterization it will work even to 1100nm.
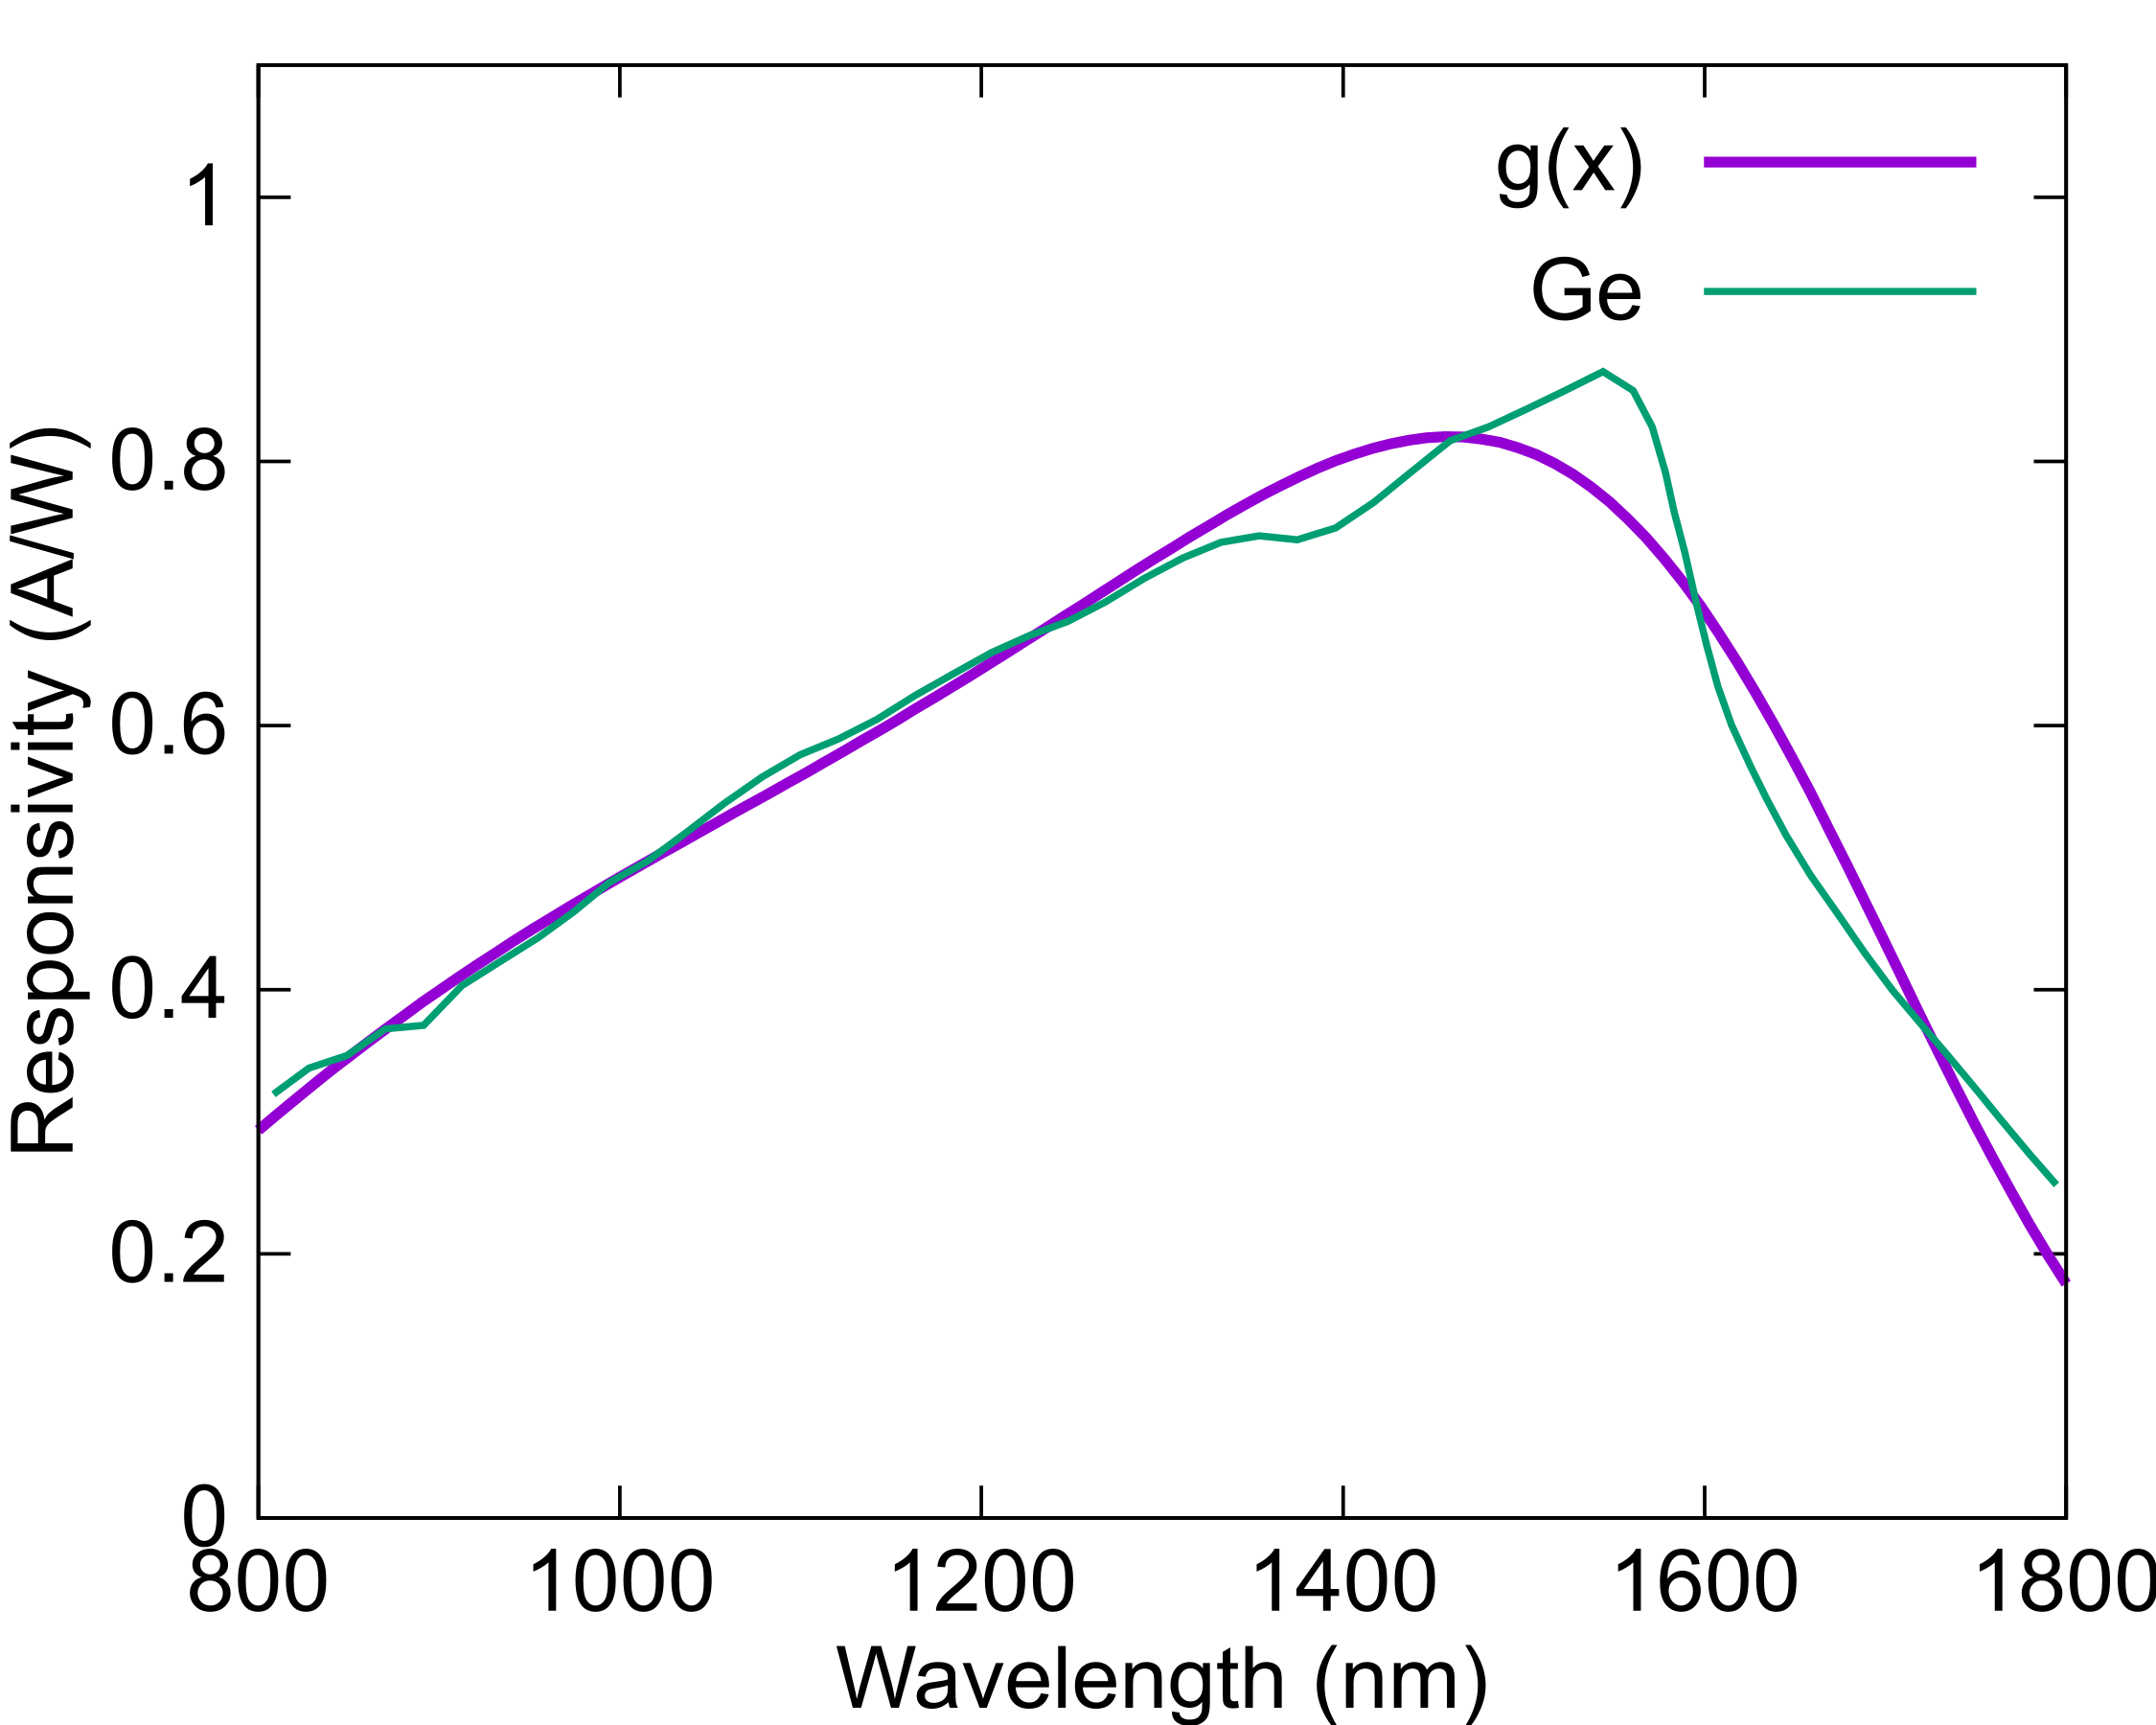
The Germanium (Ge) photodiode responsivity fit, fig. 3 is not as tight as the Si fit, but still the main trends are captured correctly.
g(x)= alpha * exp(-((x - mu)**2 / (2 * sig**2))**n)/(1+exp(-k*(x-xcs)))
alpha = 3.45562
mu = 1168.54
sig = 376.352
n = 2.01975
xcs = 2107.7
k = 0.00162578
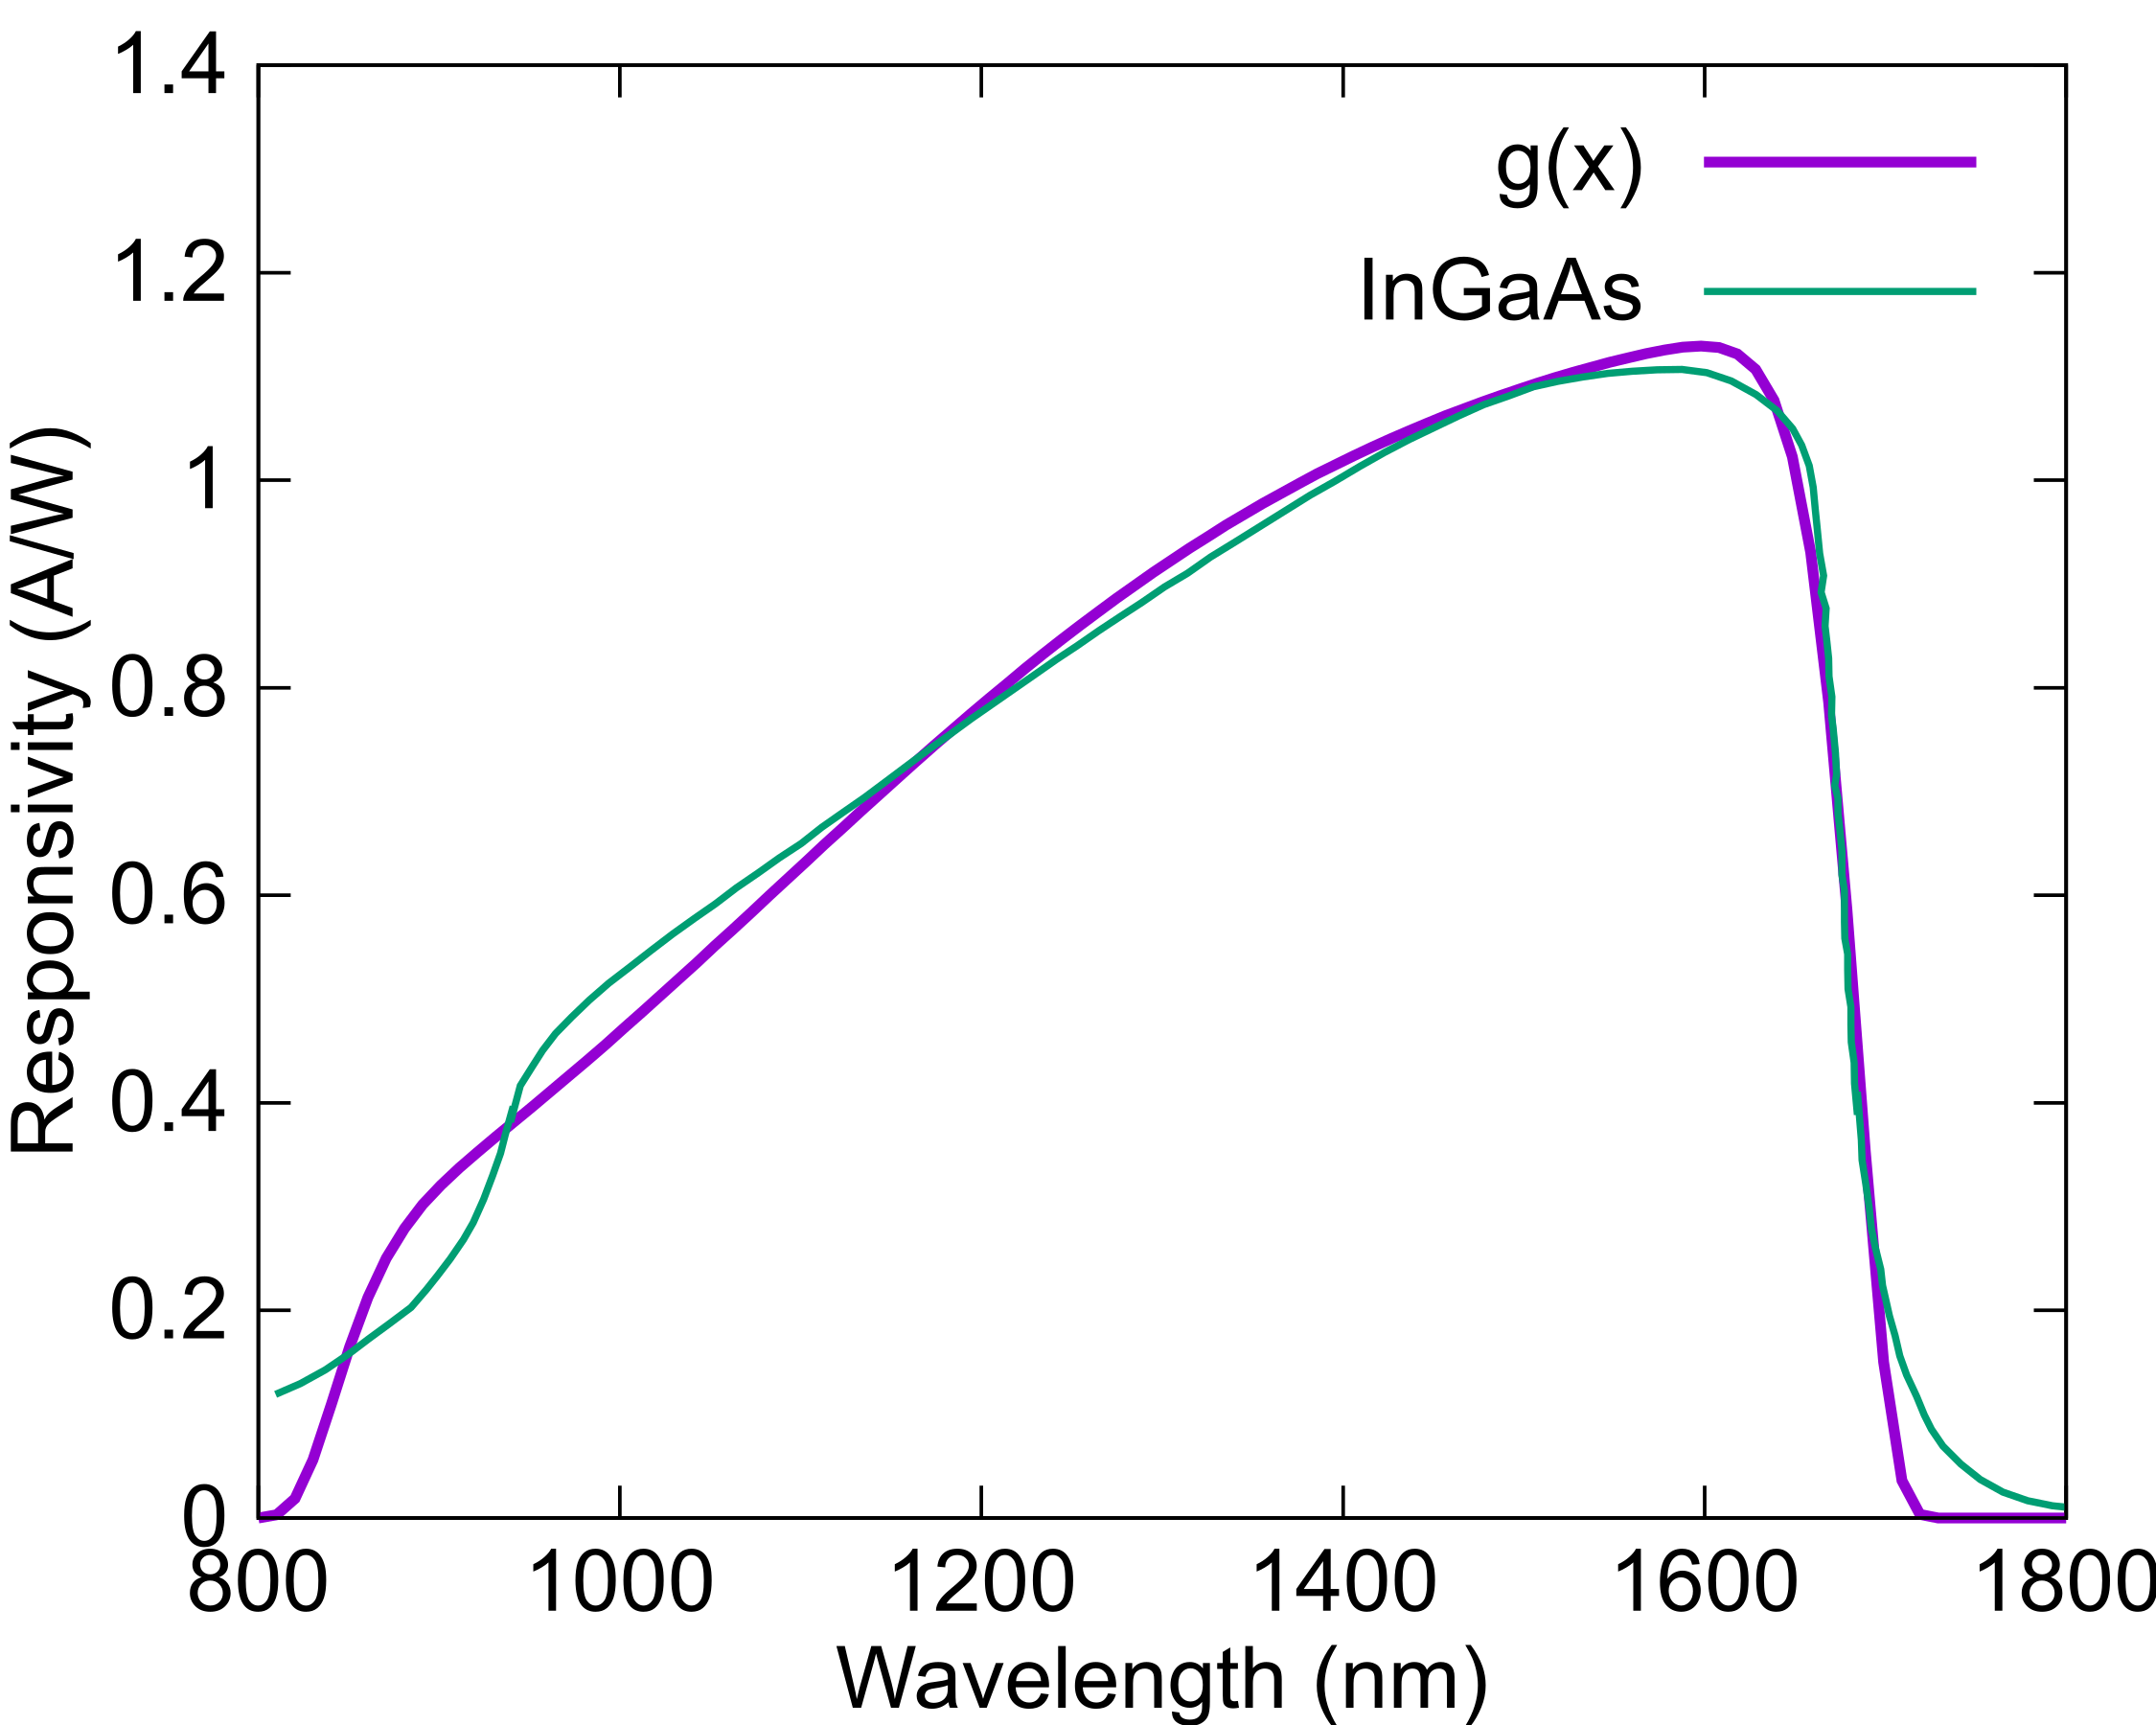
g(x)= alpha * exp(-((x - mu)**2 / (2 * sig**2))**n)/(1+exp(-k*(x-xcs)))
alpha = 1.20746
mu = 1261.6
sig = 299.891
n = 11.6189
xcs = 1085.17
k = 0.00535153
The fit to the InGaAs responsivity is not perfect, but it was actually the first I used to make a correction. At the time I was measuring a broad band source with the PD calibrated using a laser line source. I have not found any discussion of function approximation to PD Responsivity curves in the literature, so that is why I bring it here. I started out fitting several Lorentzians, with little success.
The tilted super Gaussian fit function yield a useful fit with 6 variables. The responsibility curves are all of 25°C, expect a shift to longer wavelength for higher temperatures. Below is a text document with gnuplot commands that I used for the plot and fit; gnuplot&fit.txt.
Photodiode suppliers
A large variate of photodiodes are available from electronics component resellers, DigiKey, farnell, RS electronics, Mouser. For some more specialized photodiodes you can try OEC GmbH, OSI Optoelectronics and Hamamatsu.
In selecting a photodiode the main considerations are the wavelength and the speed of the signal to be detected. The responsivity is more or less the same for all photo diodes of the same type, so the A/W is the same. It is typically easier to collect more light, more W with a large photodiode, which translates to more current signal for a large area photodiode compared to a smaller one with the same responsivity. The parasitic capacitance is larger, the larger the photo diodes, for that reason a small active area photodiode has faster response that a larger one. A large photodiode has more chip area and cost more. For modules that it true to a limit where photodiodes for high speed (>1GHz) use small active area but more expensive electrical internal connections demanding a higher price.
Reverse bias of the photodiode increase the speed by exerting drive force on the electron hole pairs. If all the photodiode is illuminated some absorption will occur outside the reverse bias field and created electrons and holes will slowly diffuse to the anode and cathode respectively. This is seen as a slow tail on the pulse response. This can be avoided by focusing the light on the center portion of the active photodiode area or some photodiodes like the OEC GmbH No Slow-Tail Photodiodes have a metal mask deposited on the front of the diode, restricting light to only the active biased region.
There are a lot of different photodiodes available, covering all sorts of detection needs. Just in the electronics component stores there are for example 428 at Mouser, 300 at farnell, 1000 at DigiKey and 391 at RS-online, hits at the time of writing. From the specialty supplier you can get photodiodes with special responsivity or the no slow tail feature. By using your own photodiode PCB, like the projects or your own design you get access to this variety of photodiodes to tailor a detector solution to your needs.
Data files for download
| Description | File name | Download |
|---|---|---|
| gnuplot scripts for plots and fits in this article | gnuplot_fit.txt | Download |
| Si photodiode responsivity | SiR.csv | Download |
| Ge photodiode responsivity | GeR.csv | Download |
| InGaAs photodiode responsivity | InGaAsStandardR.csv | Download |